Learning experience on the Google Data Analytics Course on Coursera (Second Half)
2023-08-10
I can’t believe it has been a year since I published this post:〈Overall Feedback on the Google Data Analytics Course on Coursera (First Half)〉
I received a lot of feedback and blog post traffic from that post. In fact, I had completed the 5th to 7th courses of the Google Data Analytics program. However, due to my move abroad and the intensity of the Full-time MBA courses, I had to pause the course. Part of this review has been sleeping in my drafts for a year, but now it’s time to conclude it.
Let’s take a look at it. This course includes the following 8 classes:
●Foundations: Data, Data, Everywhere
●Ask Questions to Make Data-Driven Decisions
●Prepare Data for Exploration
●Process Data from Dirty to Clean
●Analyze Data to Answer Questions
●Share Data Through the Art of Visualization
●Data Analysis with R Programming
●Google Data Analytics Capstone: Complete a Case Study
I will be focusing on the 5th to 7th courses in this post. Please feel free to click the link above to read the first part of my review.
How Can Google Data Analytics Courses Help Business Professionals?
My answer is affirmative. In fact, I thoroughly enjoyed the process of taking this course. Not only did completing the syllabus bring a sense of achievement, but the course content itself was also engaging.
After writing my previous reflection, I searched on various platforms for articles related to data analysis. Most of these articles were quite technical, with only a few touching on career aspects. I feel it’s necessary to discuss why I decided to take this course here.
My initial motivation to take this course stemmed from my challenges in efficiently addressing issues in my role as a cross-region product manager. These challenges spanned the realms of inventory management and business operations. In my daily work, I needed to frequently and extensively analyze the market demand for each product category. This required considering factors such as the timing for product phase-in/phase out, product life cycle, production lead time, seasonality, and sales periods. Sometimes, I have to collaborate with marketing team to draw the best strategy to deliver a product to a market.
While conversing with many senior colleagues and supervisors, I gained a general understanding of various methods that could be applied. Over the years, I also developed some personal techniques to address certain problems. However, these methods leaned towards manual and experience-based approaches. They were not only difficult to replicate but also challenging to adapt to different regions. Consequently, when faced with inquiries from colleagues and supervisors about passing on expertise, I often found myself at a loss. This led me to plant the seed of systematically organizing my work. However, at that time, my knowledge of tools was limited. I only knew that the company’s IT department could develop dashboards and reports. Yet, I lacked a clear understanding of how to write development specifications for these tools and effectively utilize them. I frequently operated under the mindset of “address it when encountered / modify it when encountered.”
For example, to manage inventory in a new country, what information should the business unit have in order to review and time the factory orders effectively? How can we ensure that the inventory is not replenished excessively, leading to slow-moving stock in the future? When not familiar with the logic of tool development and analysis, we often rely on experience to accurately predict customer demand. Additionally, we need to consider factory lead times, shipping times, and set inventory levels (in cases of limited storage space, inventory restrictions might also need to be established). All of this need to cope with the transition of product phase-in/phase out.
The earlier aspects are somewhat feasible through manual efforts, but setting inventory levels is a headache. Should historical sales records be used for calculations, or should we create future trend forecast reports and combine them with historical data for analysis? Which approach is more accurate and efficient? Those with experience in this field can likely empathize that forecasting market demand often feels like gambling. We often joke that we might as well go to sleep and dream about it, who knows, we might dream up some answers…
Thus, this report constantly switches between calculating using internal order quantities and using actual sales figures from the distribution channels. No one knows for sure which logic is the most efficient and accurate. Moreover, it’s common to encounter situations where the numbers displayed by the developed tool seem illogical or inconsistent with data from other sources.
With limited engineering development resources, if the analytical logic isn’t well-defined from the start, the resulting reports often end up unused (wasting development resources), or they require manual adjustments (wasting implementation manpower), making them impractical. Addressing the second scenario, it’s also difficult to pinpoint the issues when you lack an understanding of how data tools are developed.
Later on, our company established a marketing analysis department, and through interactions with them, I learned about this data-analytic field of study. I realized that these techniques are not limited to digital advertising effectiveness in marketing analysis, nor are they exclusively for becoming a data analysis. This sparked my interest in the course. I hoped it would help me understand practical analysis and bridge the gap in business analysis theory that I lacked from my previous academic background. After taking the course, I found it indeed met my needs. Although it didn’t directly address my specific challenges, it provided me with various ways of utilizing data. Furthermore, my past work experience greatly assisted me in grasping this discipline.
Course 5- Analyze Data (SQL)
In my previous post, I mentioned that I enjoy solving SQL problems. When I reached Course 5, “Analyze Data to Answer Question,” I had more opportunities to learn additional SQL examples and fundamental concepts. For someone like me with a background in the humanities (e.g., myself), this initially seemed as complex as deciphering ancient scriptures. However, I quickly realized that its core concepts were quite similar to Excel, but it could handle a larger amount of data at once, facilitating integration, filtering, sorting, and other complex requirements.
Of course, there are some “fancy tricks” in this course as well. However, overall, the course’s objective remains focused on the theme of “the master leads you to the door, but the practice is individual.” It doesn’t delve too deeply into complex and advanced cases.
I liken it to cooking—a diverse range of approaches can be used to make pork rib soup. The difference lies in the precision of the ingredients, the time spent, and the degree of deliciousness. In the end, however, a bowl of pork rib soup can be prepared.
Quoting a statement I like from a Korean chef Mr. Paik :
“Using premium chili powder here would be fantastic, but it’s also fine without. Whatever you have at home, use it, and it will still be delicious.”
When it comes to working with data, some people prefer using complex integrated functions in Excel, performing desired filtering and calculations all in one cell, and then adding formatting for a visually appealing report. However, as someone with less-than-sharp eyesight and no cure for it, I’d rather use multiple columns to separately perform different calculations before combining them. This makes it easier to check whether the formulas are correct or have gone astray. This approach works just as well and doesn’t affect the results.
From my current basic understanding of SQL, it’s somewhat similar. Many of its functionalities can be learned as you encounter them or explored in depth according to your specific needs. There are numerous examples and resources available online:
SQL resource:
Approaching this course with such a mindset, I began to feel that the distance wasn’t as far as I had imagined. It turns out that I am capable of answering all the SQL exercises in class, and I find it incredibly enjoyable.
While my understanding of SQL remains quite shallow, I had a realization during a conversation about website login method. I thought, “Hey, the registration function involves writing SQL!” and it struck me that every time a member logs in, it’s all about reading data.
Apart from this, if you’re creating a website to display search results, the process of fetching data also involves using SQL. It’s like using the SQL statement “SELECT desired columns FROM a certain dataset.”Experiencing this sensation is akin to suddenly understanding what someone is saying in a language you’ve been learning, and it’s incredibly satisfying!
Course 6—— Presentation
The next section, which digs into chart visualization, is even more intriguing. Essentially, it’s like attending a mini presentation course on the side. Although it might sound a bit cliché or repetitive, I believe it’s actually quite valuable for assessing one’s own presentation content.
I often find that analysts in the company are incredibly skilled. The same set of data, when in their hands, transforms into remarkably clear charts of various types, many of which are introduced in this course. Some seemingly basic concepts turn out to be unexpectedly practical. For instance, the Decision-Tree teaches you how to choose the right type of chart. Then there’s David McCandless’ four principles of chart visualization, which can help us ensure the charts are impactful enough when creating presentations in the future:
Information (data)
Story (concept)
Goal (function)
Visual form (metaphor)
Additionally, it provides a few steps and tricks to help us create simpler and more comprehensible presentations. However, overall, they only tackle very basic part of Tableau. If you’re interested, you can gather some real-world data and experiment with Tableau on your own to gain practical experience.
PS: The free version of Tableau only allows for public data publishing. If privacy considerations come into play, you might consider delving into the next course to explore using R for visualizing charts.
I also found the part tackle Bias and Data Science Ethics is very useful. Such as Misrepresentation, you may refer to the following video to learn more Misrepresentation. Other reference: Data Science Ethics
Course 7——R Language
I suppose those who have reached this point have conducted quite an in-depth “investigation” into this course. R language is a programming language used in data analysis, which can be employed for data cleaning, visualization, modeling, and more. During your research, you’ve likely come across questions like: “Why we have to learn R?” or “Why not learn Python instead, since it can handle these tasks and has broader applications beyond data processing?”
Google just launched Advanced Data Analytics for Certificate, Python is included in there. I’m still hestitating to take it though:Google Advanced Data Analytics Professional Certificate
Due to my curiosity about programming, I’ve already dabbled a bit in Javascript and “How to code” on Codecademy. For me, the opportunity cost of learning two languages (R and Python) is relatively similar. It’s akin to how I decided to learn both Korean and Japanese at the same time back when I was studying languages. Since the systems are similar, learning them concurrently should complement each other.
–pause for now–
(I wrote the first part above last year. Here you’re reading 2023 version of Chloe continueing writting this piece….)
After more than half a year, during which I worked on other projects in addition to my MBA courses, I look back and realize that Google’s teaching method is truly a “hand-holding” approach. They guide you step by step—even how to install is explained thoroughly, and they practically write the code for you, serving the meal right up to your mouth!
Isn’t it quite friendly when all you need to do during exams is write just one line of code? I genuinely enjoy this approach because, rather than digging into how to write code, I’m more interested in learning how the geniuses at Google “use” code to solve a problem.
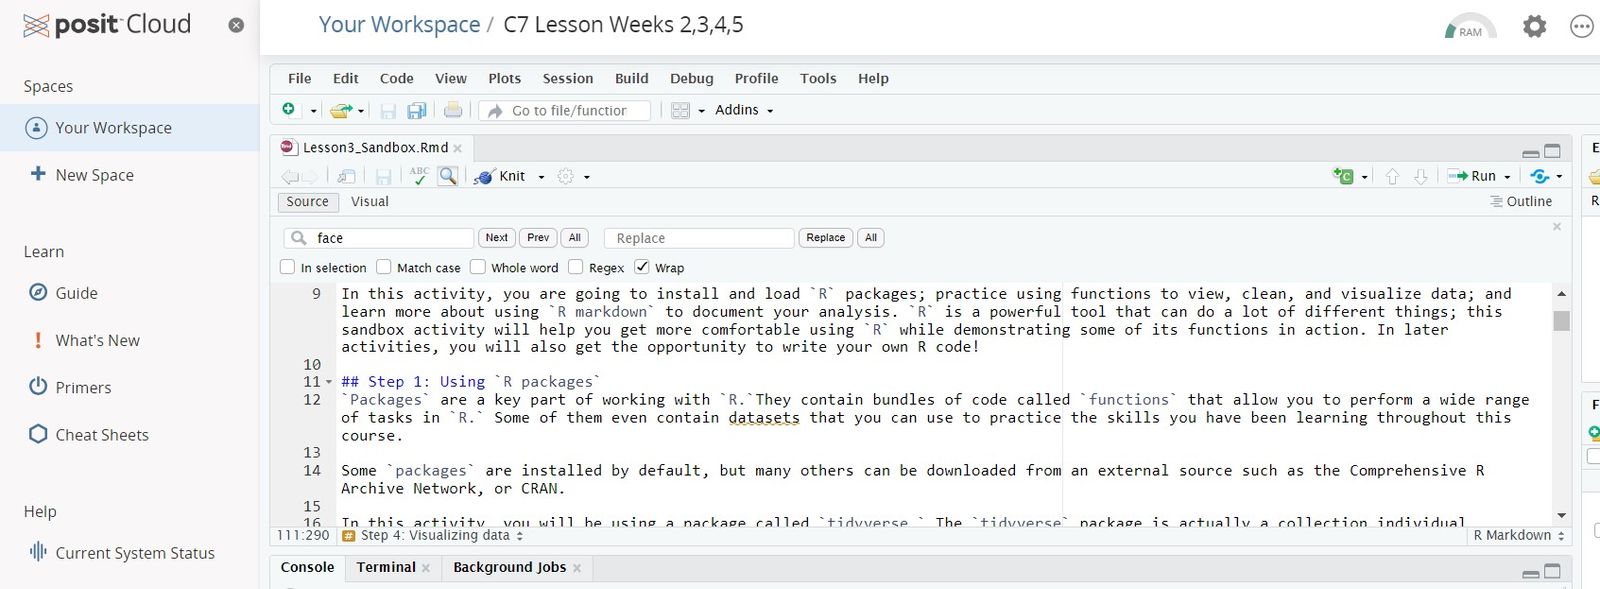
The learning experience likely depends on the student’s enthusiasm. You can choose to watch all the videos and call it a day, but you can also opt to actually install RStudio, open R Studio Cloud, and tackle the exercises. They provide numerous datasets for practice, and the hands-on activities ask you to complete the answers and execute tasks after you’ve completed each assignment. This setup quite closely resembles the feeling of attending school classes.
Rstudio-Cloud Screenshot
Google provides tasks and solutions, it wasn’t that hard.
Regarding the difficulty, I find it quite logical to start with SQL before moving on to R. This way, after completing both, R does indeed feel more “counterintuitive.” I still struggle with how to frame a set of data in R.
Furthermore, due to the increased difficulty in the second half, English might become more challenging for some individuals. However, this process likely lasts only about two weeks, and by the time you’re writing R Markdown, things ease up again.
Because…After all, I’ve been using Markdown to write blog posts for quite a while now!
Apparently, you can also write R code on VS Studio! R in Visual Studio Code
And then, coming back after a long break, what brings me the most joy is having the assistance of ChatGPT. I can ask it why something is written in a certain way.
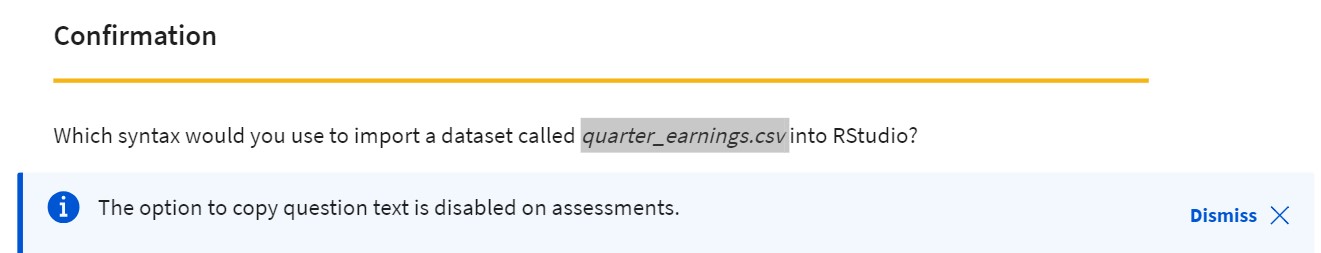
However, Google has also strengthened security measures to prevent cheating. Now there’s an added responsibility statement to sign, and copying is prohibited on assignment pages!
Even copy a string directly into the answer is not allowed; you have to type it all out yourself:
Case Study
The concept of the final Case Study in the Google Data Analytics course is quite similar to that of business school (MBA) Case Studies. It’s all about problem-solving, and here, the Data Analysis Phases are used, which also have valuable insights for product management.
● Ask - Identify the problems and challenges by consulting stakeholders/audience. Frame the problem that the analysis aims to solve.
● Prepare - Decide on the analytical approach. Personally, I like to create an issue tree and hypotheses first, and then set priorities.
● Process - Begin the analysis, starting from data cleaning to establishing the data analysis framework. This stage ensures Data Integrity, understanding data sources, and avoiding biases.
● Share - Communicate the insights gained from the analysis to stakeholders. This can provide actionable insights and involve discussions on trade-offs, as well as identifying potential directions for future analysis.
● Act - Take action based on the analysis results, such as targeting advertisements to the audience identified in the analysis.
I also completed a Marketing Strategy Case for a Wellness Product in practice. What particularly interested me was that this case aligned with the product direction I had worked on before, giving me a sense of familiarity.
However, using R to organize data was quite challenging at the beginning (I found it harder than SQL). This made me feel a bit apprehensive. After obtaining the certificate, it seems like I’ll need more practice to truly excel in jobs that require R.
Other Support
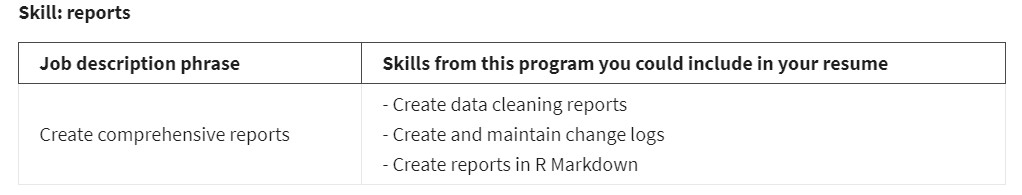
The purpose of this course is quite obvious – to help participants secure jobs, especially in the field of data analysis. As a result, the course also teaches you how to create a data-related portfolio and how to translate the knowledge gained from the course into valuable resume skills. This aspect is particularly beneficial for writing English resumes!
Especially given that more and more European and American companies are using ATS to screen resumes, choosing the right keywords to pass the initial resume review is truly crucial.
Google recommended wording:
Google believes that a good data analysis portfolio should be Simple, Unique, Personal, with a touch of personal style and perspective that appeals to Google.
Next, of course, comes the methods for job hunting and interview preparation. I really appreciate the Case Study interview videos provided in this course. The cases are intriguing, the responses from the performing data analysts are clear, showcasing the profile that Google favors in a data analyst. What’s even more significant is that the case study mirrors the tasks a product manager would undertake – including assumptions, analysis, decision-making (design direction), timelines, and even presenting additional brainstorming routes. It’s truly captivating!
The machine learning interview tool provided by Google is quite handy. It records what you say and provides suggestions for improvement:Interview-warmup
Finally, that’s wrap up this post by a quote from the course:
“One of the best pieces of advice that I still think of is that it’s better to get speeding tickets than parking tickets. Especially means as a data analyst is sometimes you have to jump into situations that you’re not totally comfortable, and you need to learn your way out of it and collaborate your way out of it.”
You will receive a certificate after completing all 8 courses:
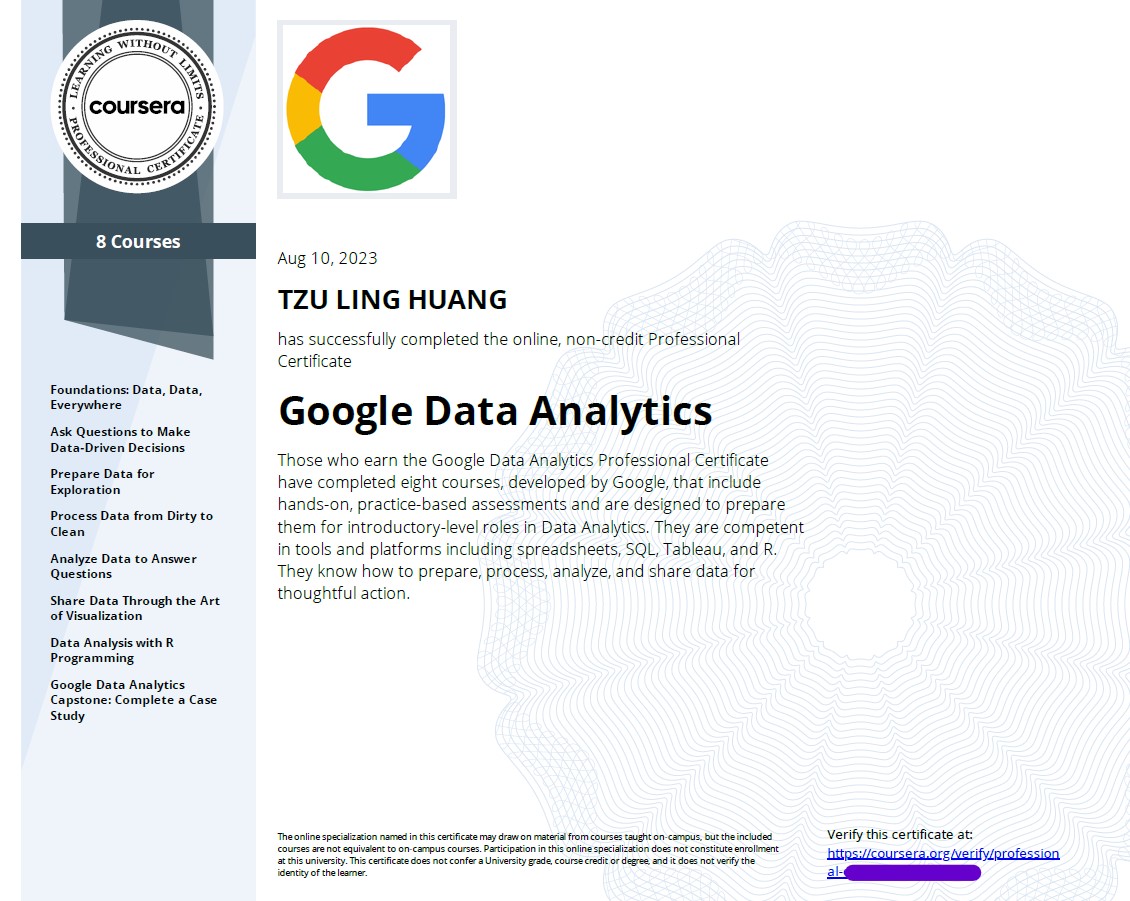
I would share more of my journey in the future after obtaining this certificate. Let’s keep in touch :)
If you’re interested in other Google related post, please refer to below:
●〈GOOGLE DATA ANALYTICS 值不值得上——上半場回顧 (COURSE1-4)〉
● 譯者可以用GOOGLE翻譯嗎?
● 為什麼還是會投GOOGLE關鍵字廣告?